
What Is a Break Even Analysis Explained
What Is a Break Even Analysis Explained – Ever wondered at what point your business will actually start making money? There’s a specific term for that magic number: break-even analysis.
Put simply, a break-even analysis tells you the exact point where your total sales cover your total costs. It’s that crucial moment when you stop losing money on your venture and every sale after that starts generating a profit. Think of it as the financial finish line you have to cross.
Uncovering Your Financial Turning Point

Let’s imagine you’ve just opened a small coffee shop in Manchester. You have bills that arrive like clockwork every month—rent (£2,000), insurance (£100), staff wages (£3,000)—regardless of how many lattes you sell. Then you have the costs that go up with every customer, like coffee beans, milk, and cups, which might work out to £1.10 per coffee sold.
So, the big question is: how many coffees, priced at £3.50 each, do you need to sell just to cover all of those expenses?
That’s precisely what a break-even analysis tells you. This isn’t just some dry academic exercise; it’s a practical signpost showing the minimum sales target you must hit to avoid being in the red.
Why This Number Matters
Knowing your break-even point brings a huge amount of clarity to your business strategy. It helps you figure out if your idea is even viable before you sink too much money into it or launch a new product line. It’s a fundamental tool that thousands of UK businesses rely on to make critical decisions.
For instance, data from UK small business surveys shows that a new retail startup with annual fixed costs of £20,000 and selling an item for £25 with a variable cost of £15 would need to sell 2,000 units just to break even. This insight is so vital that UK government support programmes often stress its importance; businesses that perform this analysis have been shown to cut their risk of early-stage failure by around 15%. You can dig deeper into these findings in the UK Business Data Survey 2024.
Ultimately, your break-even analysis empowers you to:
- Set realistic sales goals by giving your team a tangible, meaningful target to aim for.
- Make informed pricing decisions to ensure every sale contributes enough towards covering your costs.
- Assess financial risk when you’re thinking about new expenses, like hiring another team member or moving to a bigger office.
By identifying the point where costs and revenue are equal, you transform financial uncertainty into a clear, actionable plan. It’s the first step toward building a sustainable and profitable business.
The Building Blocks of Your Break-Even Point
Before you can work out your break-even point, you need to get your head around its three essential ingredients. Think of it like a recipe: get these components right, and the final result will be accurate and incredibly useful for making decisions. These building blocks are your fixed costs, variable costs, and the selling price of whatever it is you sell.
Getting your expenses categorised correctly is the first—and most crucial—step. A solid grasp of your numbers is fundamental to good business, and if you’re just starting out, getting familiar with small business accounting basics will put you on the right path from day one.
Understanding Your Fixed Costs
Fixed costs are the expenses that stay the same every month, no matter how much you sell. They’re the predictable, consistent bills you have to pay just to keep the lights on. Even if you had a terrible month and sold absolutely nothing, these costs would still be there, waiting to be paid.
For example, if you run a small digital marketing agency from an office in Manchester, your monthly rent of £800 is a classic fixed cost. It doesn’t change whether you land one client or ten.
Other common examples include:
- Annual insurance premiums
- Salaries for your full-time staff
- Website hosting fees
- Loan repayments
These costs form the baseline of your expenses—the total figure you must cover before you can even think about making a single penny of profit.
Identifying Your Variable Costs
Unlike their fixed cousins, variable costs move in lockstep with your sales. The more you produce or sell, the higher these costs become. If you sell nothing, your variable costs are zero. Simple as that.
Imagine you own a bakery in Bristol famous for its sourdough. The flour, yeast, and salt you use for each loaf are all variable costs. If these ingredients cost £0.80 per loaf, and you bake 100 loaves, your variable costs for that batch are £80. The more loaves you bake to meet Saturday morning demand, the more ingredients you’ll need to buy.
Key Takeaway: Variable costs are tied directly to each item sold. They represent the cost of producing one unit or delivering one service, making them a critical piece of your profitability puzzle.
To help you sort your own costs, it’s useful to see how they apply to different types of businesses.
Fixed vs Variable Costs Common UK Business Examples
The table below breaks down typical fixed and variable costs for two common UK small business models: an e-commerce store and a local cafe. Use it as a guide to start classifying your own expenses.
| Cost Type | Definition | Example for a UK E-commerce Business | Example for a UK Cafe |
|---|---|---|---|
| Fixed Costs | Expenses that remain constant regardless of sales volume. | Monthly Shopify subscription, warehouse rent, employee salaries, website hosting. | Rent for the premises, business rates, staff salaries, insurance, POS system subscription. |
| Variable Costs | Expenses that change in direct proportion to sales volume. | Cost of goods sold (the products themselves), packaging materials, shipping fees, transaction fees. | Coffee beans, milk, sugar, takeaway cups, ingredients for cakes and sandwiches. |
Seeing your costs laid out like this makes it much easier to separate what you have to pay each month from what you only pay when you make a sale. This distinction is the bedrock of break-even analysis.
Introducing the Contribution Margin
The final piece of the puzzle is the contribution margin. This might sound a bit technical, but the concept is simple and incredibly powerful. It’s the amount of money from each sale that’s left over to help pay down your fixed costs.
You calculate it with a straightforward formula:
Selling Price Per Unit – Variable Costs Per Unit = Contribution Margin Per Unit
Let’s go back to that Bristol bakery. If a loaf of sourdough sells for £4.00 and the variable costs (flour, yeast, etc.) add up to £1.50, the contribution margin is £2.50.
This means every single loaf sold contributes £2.50 towards paying the bakery’s rent, salaries, and other fixed expenses. Once all those fixed costs are covered for the month, that £2.50 from each extra sale becomes pure profit.
How to Calculate Your Break-Even Point
Now that we’ve covered the essential ingredients, it’s time to put them together and find your break-even point. The calculation itself is surprisingly straightforward, turning all your cost data into a single, actionable target. We’ll look at the two main formulas you’ll need: one for the number of units you need to sell, and another for the total sales revenue you need to hit.
The Break-Even Formula in Units
To figure out exactly how many products you need to shift to cover your costs, we’ll use the contribution margin we talked about earlier. The formula is beautifully simple:
Fixed Costs / Contribution Margin Per Unit = Break-Even Point in Units
This calculation gives you the precise volume of sales you need to reach the point where you stop losing money. Every single unit sold after this number is pure profit.
The Break-Even Formula in Sales Revenue
Sometimes, knowing the number of units isn’t all that helpful. This is especially true for service businesses or companies selling a wide range of different products. In these cases, it’s much more useful to know the total sales revenue you need to bring in. For this, you’ll need to calculate your contribution margin ratio first.
- Contribution Margin Ratio = (Contribution Margin Per Unit / Selling Price Per Unit)
- Break-Even Point in Sales (£) = Fixed Costs / Contribution Margin Ratio
This gives you a target in pounds rather than units, which can be much easier to track against your financial goals. If you want a quick way to run the numbers, you can always use a dedicated break-even calculator to check your figures.
A Practical Example: A London Craft Brewery
Let’s bring this to life with a real-world scenario. Imagine a small craft brewery in London called “Thameside Ales.” We need to work out how many cases of their signature IPA they must sell each month just to break even.
First, let’s lay out their costs:
- Total Monthly Fixed Costs: £5,000 (this covers rent on their archway brewery, staff salaries, and insurance).
- Selling Price Per Case: £24.
- Variable Costs Per Case: £9 (this includes bottles, ingredients, packaging, and shipping).
Now, we can plug these numbers into our formulas.
- Calculate the Contribution Margin Per Case:
£24 (Selling Price) – £9 (Variable Costs) = £15 - Calculate the Break-Even Point in Units (Cases):
£5,000 (Fixed Costs) / £15 (Contribution Margin) = 334 cases (rounded up)
Thameside Ales must sell 334 cases of their IPA each month just to cover all their expenses. The 335th case sold is their first taste of actual profit.
This concept map helps visualise the relationship between your fixed costs, variable costs, and selling price when working out the break-even point.
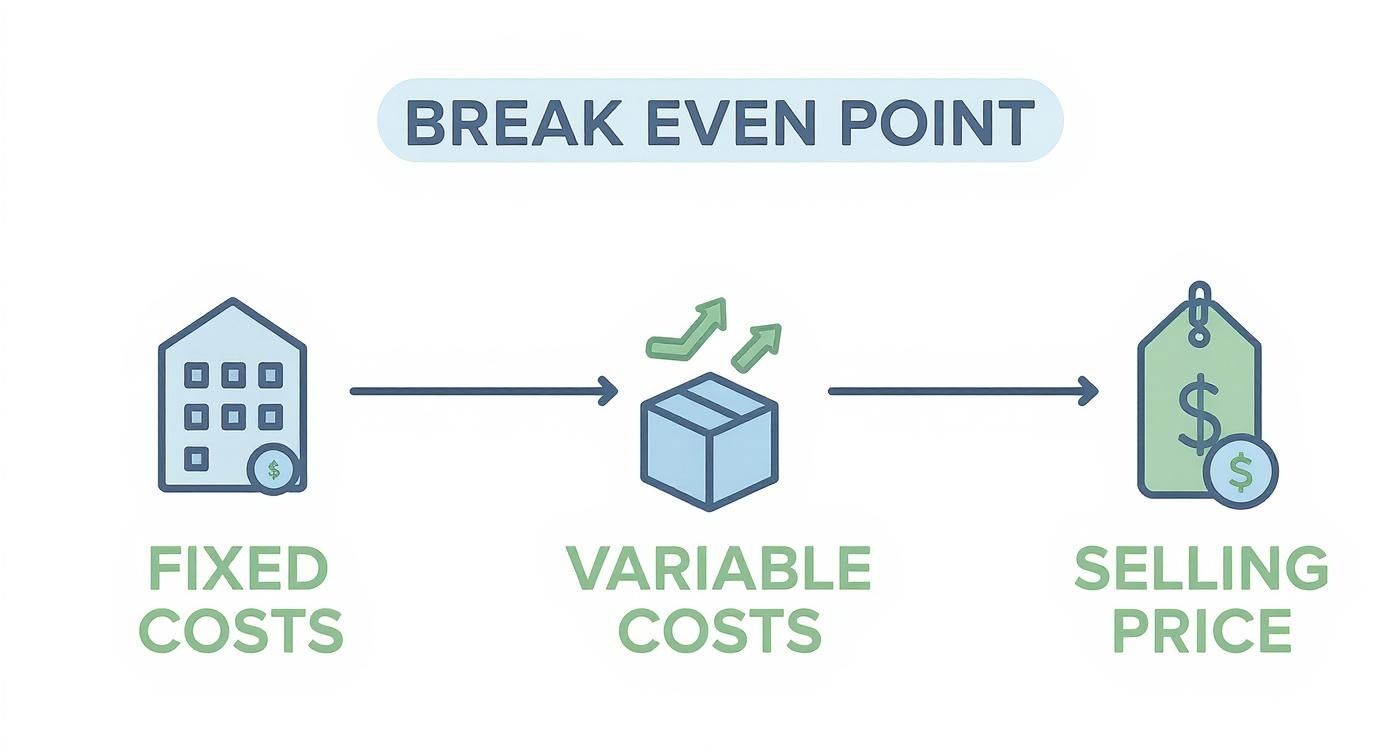
As the infographic shows, getting a handle on how these three core components interact is fundamental to pinpointing whether your business is financially viable.
Historically, this calculation has been a vital tool for UK businesses trying to navigate economic change. Following the 2008 financial crisis, for instance, over 70% of UK SMEs adopted break-even analysis to stabilise their operations. This move was directly correlated with a 10% improvement in survival rates, highlighting its enduring value as a strategy for resilience in the UK’s economic environment.
Checkout our Break Even Calculator
Break Even Analysis in the Real World
The formulas are a great starting point, but seeing break-even analysis in action is where it really clicks. It’s one thing to know the theory; it’s another to see how it applies to a real business trying to make ends meet.
While the core principles are the same for everyone, the practical application looks a bit different depending on what you sell. To make it concrete, let’s walk through two relatable scenarios for UK small businesses. First, we’ll look at a product-based business—a small, handmade cosmetics company. Then, we’ll switch gears to a service-based business—a freelance graphic designer—to see how they figure out the billable hours needed to stay afloat.
Example One: A Product-Based Business
Meet “Cornwall Organics,” a small company that makes and sells beautiful handmade soap bars. The owner is passionate about her craft, but she needs to know exactly how many bars she has to sell each month just to cover her costs. No guesswork, just a clear target.
Let’s break down her numbers:
- Total Monthly Fixed Costs: £1,200. This covers her workshop rent, website hosting, insurance, and the modest salary she pays herself. These costs stay the same whether she sells one bar or a thousand.
- Selling Price Per Soap Bar: £6.
- Variable Costs Per Soap Bar: £2.50. This is the cost of raw ingredients (like oils and botanicals), packaging, and the small payment processing fee she pays on every single sale.
With these figures, the first step is to work out her contribution margin—the amount each sale contributes towards paying off those fixed costs.
£6.00 (Selling Price) – £2.50 (Variable Costs) = £3.50 (Contribution Margin)
Every single bar she sells puts £3.50 in the pot to tackle that £1,200 of fixed costs. Now, we can find her break-even point in units.
£1,200 (Fixed Costs) / £3.50 (Contribution Margin) = 343 bars (rounded up)
The Verdict: Cornwall Organics must sell 343 soap bars every single month just to cover its expenses. Every bar sold after the 343rd is pure profit. That number isn’t just a metric; it’s a powerful target for the owner to focus on.
Example Two: A Service-Based Business
Now, let’s head over to Cardiff and meet a freelance graphic designer. For service businesses, the “unit” sold isn’t a physical product; it’s an hour of their time and expertise. The designer wants to figure out the minimum number of billable hours they need to work each month to break even.
Here are their monthly financials:
- Total Monthly Fixed Costs: £2,000. This covers home office expenses, professional indemnity insurance, vital design software subscriptions (like Adobe Creative Cloud), and the basic living costs drawn as a salary.
- Selling Price Per Hour: £50.
- Variable Costs Per Hour: £5. These are costs directly linked to client work, like project management software fees, transaction fees on invoices, and a small budget for project-specific assets like stock photos.
Just like with the soap maker, we start by finding the contribution margin.
£50 (Hourly Rate) – £5 (Variable Costs) = £45 (Contribution Margin per Hour)
So, each billable hour contributes £45 towards the designer’s fixed monthly costs. Let’s calculate the break-even point in hours.
£2,000 (Fixed Costs) / £45 (Contribution Margin) = 45 hours (rounded up)
The designer needs to bill for 45 hours of work each month simply to cover all their costs. This is their baseline for survival. Knowing this gives them a clear, minimum target, helping them plan their workload and understand that any time billed beyond this point is what builds their profit and grows the business.
Break Even Scenarios: Product vs Service Business
These two examples show just how flexible break-even analysis is. Whether you’re selling a physical item or your time, the logic holds. The table below gives you a side-by-side look at how the metrics differ between a product and a service model.
| Metric | UK Product Business (Soap Maker) | UK Service Business (Graphic Designer) |
|---|---|---|
| Unit of Sale | One soap bar | One billable hour |
| Selling Price | £6.00 per bar | £50.00 per hour |
| Variable Costs | £2.50 per bar (ingredients, packaging) | £5.00 per hour (software fees, assets) |
| Contribution Margin | £3.50 per bar | £45.00 per hour |
| Fixed Costs | £1,200 per month | £2,000 per month |
| Break-Even Point | 343 bars per month | 45 hours per month |
As you can see, the ‘unit’ is the biggest difference, but the goal is the same: find that magic number where revenue perfectly covers costs. For any entrepreneur, this isn’t just an accounting exercise—it’s the first major milestone on the road to profitability.
Using Break-Even Analysis for Smarter Decisions

Knowing your break-even point is enlightening, but its real power is unlocked when you use it as a dynamic tool for decision-making. It transforms from a static number into a strategic compass, helping you map out the financial impact of future choices before you commit.
Ultimately, this analysis helps you answer the tough “what-if” questions that every business owner faces. By running different scenarios, you can confidently assess risks and opportunities, bringing hard data into conversations that might otherwise be driven by gut feeling alone. It’s what keeps you agile and ensures your choices support long-term stability and growth.
Modelling Future Scenarios
One of the most valuable ways to use break-even analysis is to test the financial effects of big business changes. By tweaking the components of your formula—fixed costs, variable costs, or price—you can see exactly how a decision will alter your path to profitability.
Let’s use our “Cornwall Organics” soap business as a practical example. The owner is considering hiring a part-time assistant for £600 per month.
- Old Fixed Costs: £1,200
- New Fixed Costs: £1,200 + £600 = £1,800
- Contribution Margin: £3.50 (this hasn’t changed)
- New Break-Even Point: £1,800 / £3.50 = 515 bars (rounded up)
Suddenly, she needs to sell an extra 172 soap bars every month just to cover the new salary. This calculation doesn’t say “don’t hire”; it asks, “Can this new hire help us sell at least 172 more bars per month?”
Other common scenarios include:
- Investing in new equipment: If a new soap mould reduces waste, the variable cost per bar might drop from £2.50 to £2.20. This increases the contribution margin to £3.80 and lowers the break-even point, showing how quickly the investment could pay for itself.
- Moving to a larger workshop: If the rent increases fixed costs by £400, the new break-even point would be (£1,200 + £400) / £3.50 = 458 bars.
By forecasting the impact of these changes, you can make strategic investments with a clear understanding of the sales performance needed to support them. This forward-looking approach is a cornerstone of effective financial management. A detailed guide on how to create a cash flow forecast can further strengthen your ability to plan for these future financial shifts.
Making Strategic Pricing Decisions
Pricing is another area where break-even analysis truly shines, especially when you’re thinking about running a sale or offering discounts. A lower price directly shrinks your contribution margin per unit, which can dramatically increase the number of items you need to sell just to cover your costs.
Let’s say Cornwall Organics wants to run a 10% off sale, reducing the soap bar price from £6.00 to £5.40.
- New Selling Price: £5.40
- Variable Costs: £2.50 (these stay the same)
- New Contribution Margin: £5.40 – £2.50 = £2.90
- New Break-Even Point: £1,200 / £2.90 = 414 bars
The business now needs to sell 71 more bars (414 vs 343) just to break even during the sale period. This simple calculation prevents you from accidentally launching a promotion that actually costs you money. It helps you ask the right question: “Is this sale likely to increase our monthly sales by more than 20%?”
When to Look Beyond Break-Even Analysis
While it’s a brilliant tool, your break-even analysis isn’t a crystal ball for your business finances. Its greatest strength—simplicity—is also its biggest weakness. It gives you a static snapshot in time, working on the assumption that your costs and prices will stay perfectly consistent.
But we all know the real world isn’t that neat.
This model doesn’t factor in market swings, seasonal dips in demand, or that dreaded email from a supplier announcing a price hike. If your material costs suddenly jump, your original break-even point becomes obsolete overnight. The calculation also assumes every single unit you sell goes for the same price, completely ignoring things like bulk discounts or promotional sales.
Understanding Its Place in Your Strategy
The limits of a break-even analysis really start to show when your business has more moving parts.
- Multiple Products: If you sell a whole range of items, all with different prices and profit margins, a single break-even point can be seriously misleading. To get an accurate picture, you’d need to calculate a weighted average based on your sales mix—something that can change from one week to the next.
- Economies of Scale: The analysis assumes your variable costs per unit are fixed. But as your business grows, you’ll likely benefit from economies of scale. Buying in bulk might lower your cost per unit, which in turn changes your entire break-even dynamic.
A break-even analysis is a foundational tool, not the final word. Think of it as your starting point. It’s designed to give you a crucial baseline, but it absolutely must be used alongside other financial tools like cash flow forecasting and profit and loss statements for a truly well-rounded view of your business’s health.
Got Questions? We’ve Got Answers
Getting to grips with break-even analysis is the first big step, but it often brings up more specific questions. Let’s tackle some of the most common ones that business owners ask.
What’s the Difference Between Break-Even Point and Payback Period?
It’s easy to mix these two up, but they tell you very different things.
Think of it like this: your break-even point is all about profitability. It tells you the exact moment—in terms of sales or units sold—when you stop losing money and start making it. It’s the tipping point from red to black.
The payback period, on the other hand, is purely about cash flow and time. It answers the question, “How long will it take to get my initial investment back?” It doesn’t care about profit, only how quickly your cash outlay is returned.
How Often Should I Calculate My Break-Even Point?
Your break-even point isn’t a “set it and forget it” number. You should run the numbers again anytime your key variables shift.
As a general rule, a quarterly review is good practice. But it becomes absolutely essential when you’re facing a big decision. Thinking about hiring new staff, launching a new product, or changing your prices? That’s the perfect time to recalculate and see how it impacts your bottom line.
Can I Use This for a Business with Multiple Products?
Yes, you absolutely can, but it requires one extra calculation. You can’t just analyse each product in isolation; you need to find a single break-even point for the entire business.
To do this, you calculate a weighted average contribution margin. This is based on your expected sales mix. For instance, if you predict Product A will make up 60% of your sales and Product B will make up the other 40%, you’d weight their individual contribution margins accordingly. This gives you a blended margin that reflects how your business actually makes money, allowing you to find a single, unified break-even point.
At Grow My Acorn, we provide the essential information and advice that entrepreneurs and small business owners need to succeed. From financial planning to growth strategies, we’re here to help you build a thriving business. Find out more at https://growmyacorn.co.uk.
More Topics

What is invoice factoring: A Clear Guide to Faster Cash Flow
Discover what is invoice factoring and how it unlocks fast cash flow for your business with simple examples and practical steps.

12 Profitable Self Employment Ideas to Start in 2025
Discover 12 practical self employment ideas you can launch this year. Our guide covers startup costs, skills, and

How to Delegate Effectively: Master Your Team Productivity
Discover how to delegate effectively with practical tips to boost team productivity, empower others, and drive better results.

How to Build an Email List from Scrath
Learn how to build an email list with our practical guide. Discover actionable strategies and expert tips to grow an audience that converts.

How to Improve Employee Retention
Discover how to improve employee retention with actionable strategies on leadership, compensation, and culture

Streamlining business processes: Boost efficiency today
Discover how streamlining business processes can unlock efficiency and drive growth with practical, actionable steps.
marketing tips for small business: 5 quick wins
Uncover marketing tips for small business that boost ROI with 5 practical strategies you can implement this week

what is professional indemnity insurance? A quick guide
what is professional indemnity insurance: learn what it covers, who needs it, and how to choose the right PI policy for your business.

10 Actionable Marketing Tips for Small Businesses in 2025
Discover 10 practical marketing tips for small businesses. Boost your growth with budget-friendly strategies for SEO,

10 Profitable Business Ideas UK from Home for 2025
Discover 10 practical profitable business ideas UK from home. This guide covers startup costs, income potential,

How to Create a Cash Flow Forecast That Works
Learn how to create a cash flow forecast with this practical guide. We cover predicting inflows, mapping outflows,

How to Write a Business Proposal That Wins Clients
Learn how to write a business proposal that actually wins clients. Offering advice and real-world examples

What Is Equity Dilution for Founders
Understand what is equity dilution and how it impacts your startup. Our guide explains cap tables, funding rounds

How to Conduct Competitor Analysis That Drives Growth
Learn how to register a business in the UK with our practical guide. We cover sole trader and limited company setups

How to Register a Business in the UK Your Complete Guide
Learn how to register a business in the UK with our practical guide. We cover sole trader and limited company setups

12 Best Ways to Advertise Your Business in 2025
12 Best Ways to Advertise Your Business Discover the best ways to advertise your business
Small Business Accounting Basics Made Simple
Master small business accounting basics with our guide. Learn bookkeeping, financial statements, and tax

Business Exit Strategy Planning Done Right
Learn what is a business model canvas and how this one-page tool helps startups visualise, test, and refine

How to Find Business Partners That Actually Fit
Discover essential business advice for startups to thrive. Complete guide from Grow My Acorn

High Street vs Digital Business Banking
Compare High Street vs Digital Business Banking for start-ups. Discover the pros and cons of business banking

10 Crucial Pieces of Business Advice for Startups
Discover essential business advice for startups to thrive. Complete guide from Grow My Acorn

How to Scale a Business The Right Way
Learn how to scale a business with proven, real-world strategies. The complete guide

A Board Meeting Agenda Template That Actually Works
Tired of unproductive meetings? Use our board meeting agenda template to drive focus, ensure compliance

Sole Trader Tax Deductions
Learn what is a business model canvas and how this one-page tool helps startups visualise, test, and refine

How to Build Business Credit for Your UK Business
Learn what is a business model canvas and how this one-page tool helps startups visualise, test, and refine
What Is a Business Model Canvas?
Learn what is a business model canvas and how this one-page tool helps startups visualise, test, and refine
How to Improve Customer Service A UK Business Guide
Discover how to improve customer service with actionable strategies for UK businesses

Dealing with Difficult Clients: Top Strategies for Success
Dealing with difficult clients isn’t about winning arguments. Learn how to deal with difficult clients.

Business Plan Executive Summary Examples: 8 Inspiring Samples
How to professionally prepare your business plan executive summary along with practical examples.

Your Guide to a Business Risk Management Framework
Build a robust business risk management framework with our free online guidance.
How to Improve Cash Flow: Proven Tips for UK Businesses
Learn how to improve cash flow with actionable strategies for UK businesses. Master invoicing, managing expenses

Social Media Marketing for Small Business
Social Media Marketing for Small Business Free Expert Guidance from Grow My Acorn the ultimate free resource
10 Powerful Customer Retention Strategies for 2025
Discover 10 actionable customer retention strategies with real examples. Learn how to boost loyalty,

How to Grow a Business The Right Way
How to Grow a Business The Right Way grow your business the right way with free expert advice

Proven Marketing Strategies for Small Businesses
Get your marketing strategy off to a flying start with our proven strategies guaranteed to deliver measurable results.

Sole Trader vs Limited Company UK Guide
Choose the right business structure. Understand the differences, benefits and pitfalls. Sole Trader? Limited Company?
How to Start a Business in the UK
How to start a business in the UK – Your handy free expert guide on how to start a business in the UK

How to Protect Your Business with Contracts and Agreements
Learn how to protect your business with contracts and agreements. A practical guide for startups

Taking the Leap: The Ultimate Guide to Hiring Your First Employee
Thinking of hiring your first employee? Take a look at our handy guide to understand when and how to recruit.

10 Proven Low-Cost Marketing Strategies for Startups
10 proven low costs marketing strategies which you can implement today to grow your business.

How Much Does It Really Cost to Start a Small Business
Wondering how much it costs to start a small business in the UK? Discover the real start up expenses for entrepreneurs,
Top 20 Home Based Business Ideas
Looking for the best home based business ideas? Discover 20 profitable ways to start a business from home
The Pros and Cons of Running a Business from Home
The Pros and Cons of running a business from home. Considering running a business from home? Read more here.
The Importance of a Business Plan
See why every start-up needs a business plan, what to include in your business plan and why. Easily draft your business plan with our free guidance.

How to Register a Business Name with Companies House: A Step-by-Step Guide for UK Entrepreneurs
Learn how to register a business name with Companies House in the UK. Step-by-step guide covering name rules, fees, documents, etc

Running a Business as a Community Interest Company
Community Interests Company. Get a detailed view of the advantages and disadvantages of running a community interests company

Running a Business as an LLP
Running a business as an LLP. Get an understanding of the LLP business structure with Grow my Acorn

Running a Limited Company in the UK
Considering forming a limited company. Read our guide to see if the Limited Company is the right business structure

Running a Sole Trader Business
Becoming a sole trader. Read our guide to becoming a sole trader and see if it is the right business structure

Running a Business Partnership
Learn how business partnerships work in the UK. Setup, taxes, liability, agreements, pros & cons
Choosing the Right Business Structure
Discover UK business structures: sole trader, partnership, LLP, Ltd, PLC, CIC & charity. Pros & cons explained